The Importance of Visual Health Communication Strategies in Research
Project Background
This was a complex 6-week longitudinal remote research study. To increase understanding of study procedures and reduce attrition, research coordinator Omaya Torres-Grillo created a series of visuals to help keep participants engaged and informed of the study tasks ahead of them, incorporating participant feedback as part of her MPH capstone project.
Areas of Focus
Two areas of participant frustration were specifically targeted:
- Setting up participant devices to complete study tasks and understand study procedures
- Answering daily surveys sent from Lifedata’s RealLife Exp app
Design Principles Applied
The graphics and instructions incorporated:
- Clear language (non-technical words and defined jargon when necessary)
- Non-condescending tone
- Only relevant information (avoiding information overload)
Participant Timeline Visualization
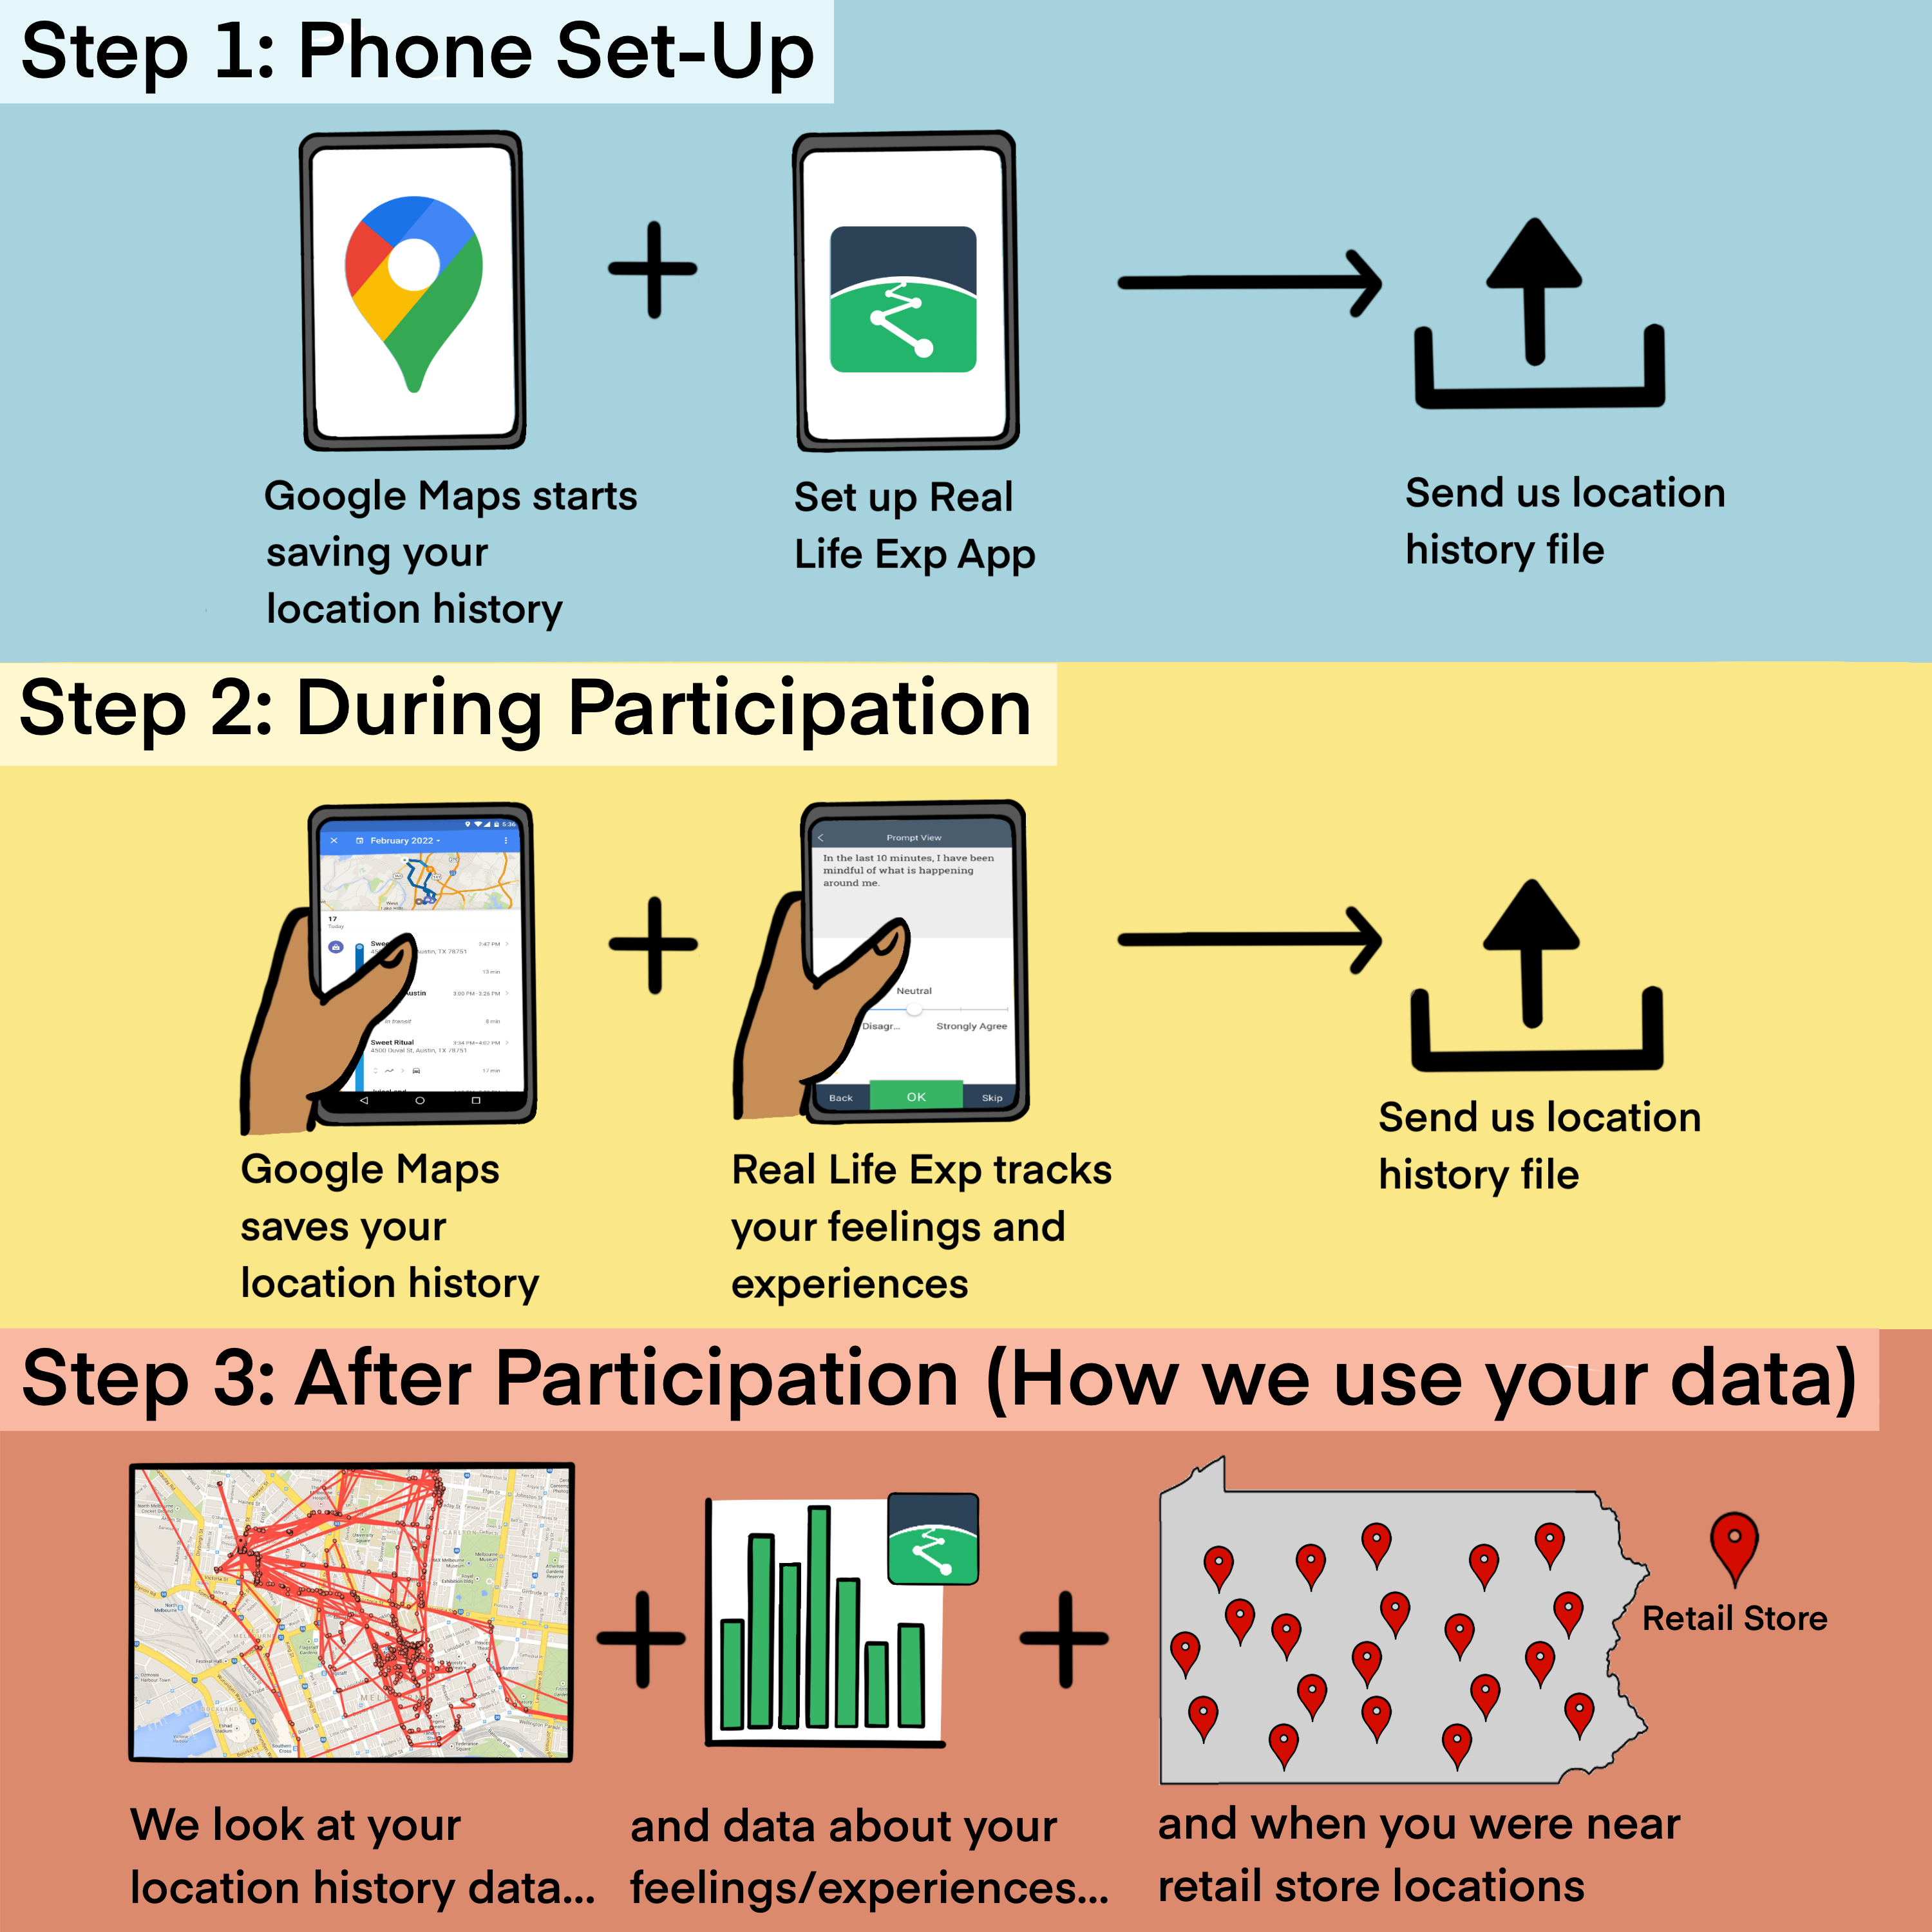
Timeline explaining how the apps on the participant's phones will be set up and used throughout the study.
Study Timeline Visualization
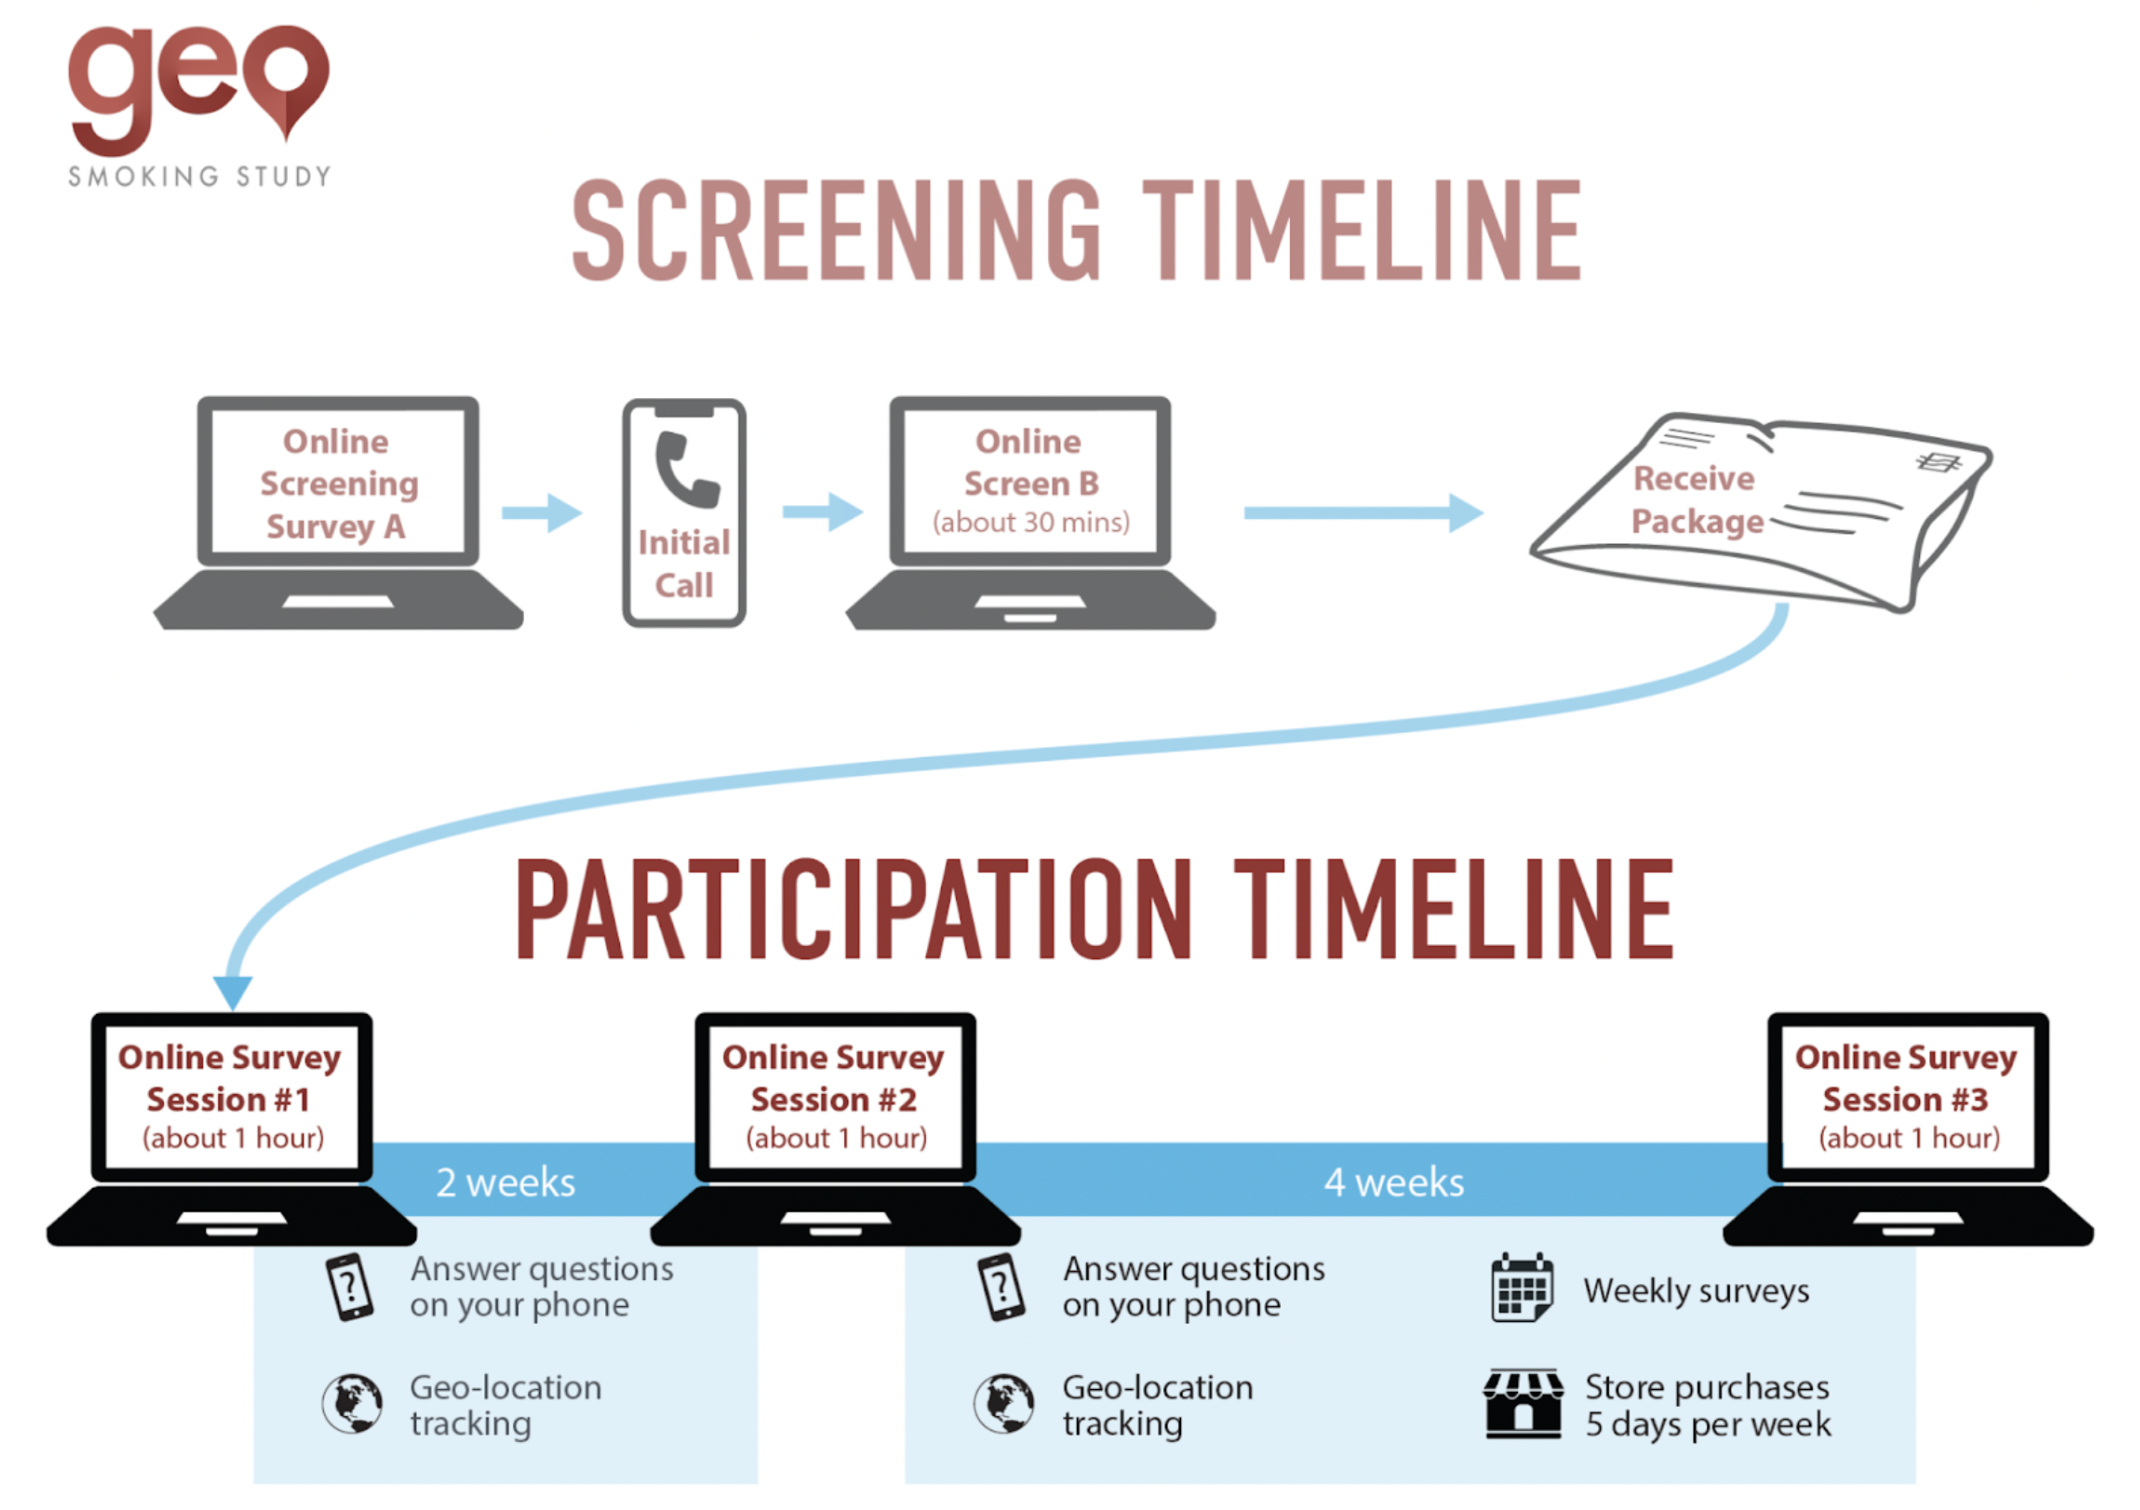
Timeline explaining how long each phase of the study is, what participants do in each stage, and when they complete the online study sessions.
EMA Survey Schedule Graphics
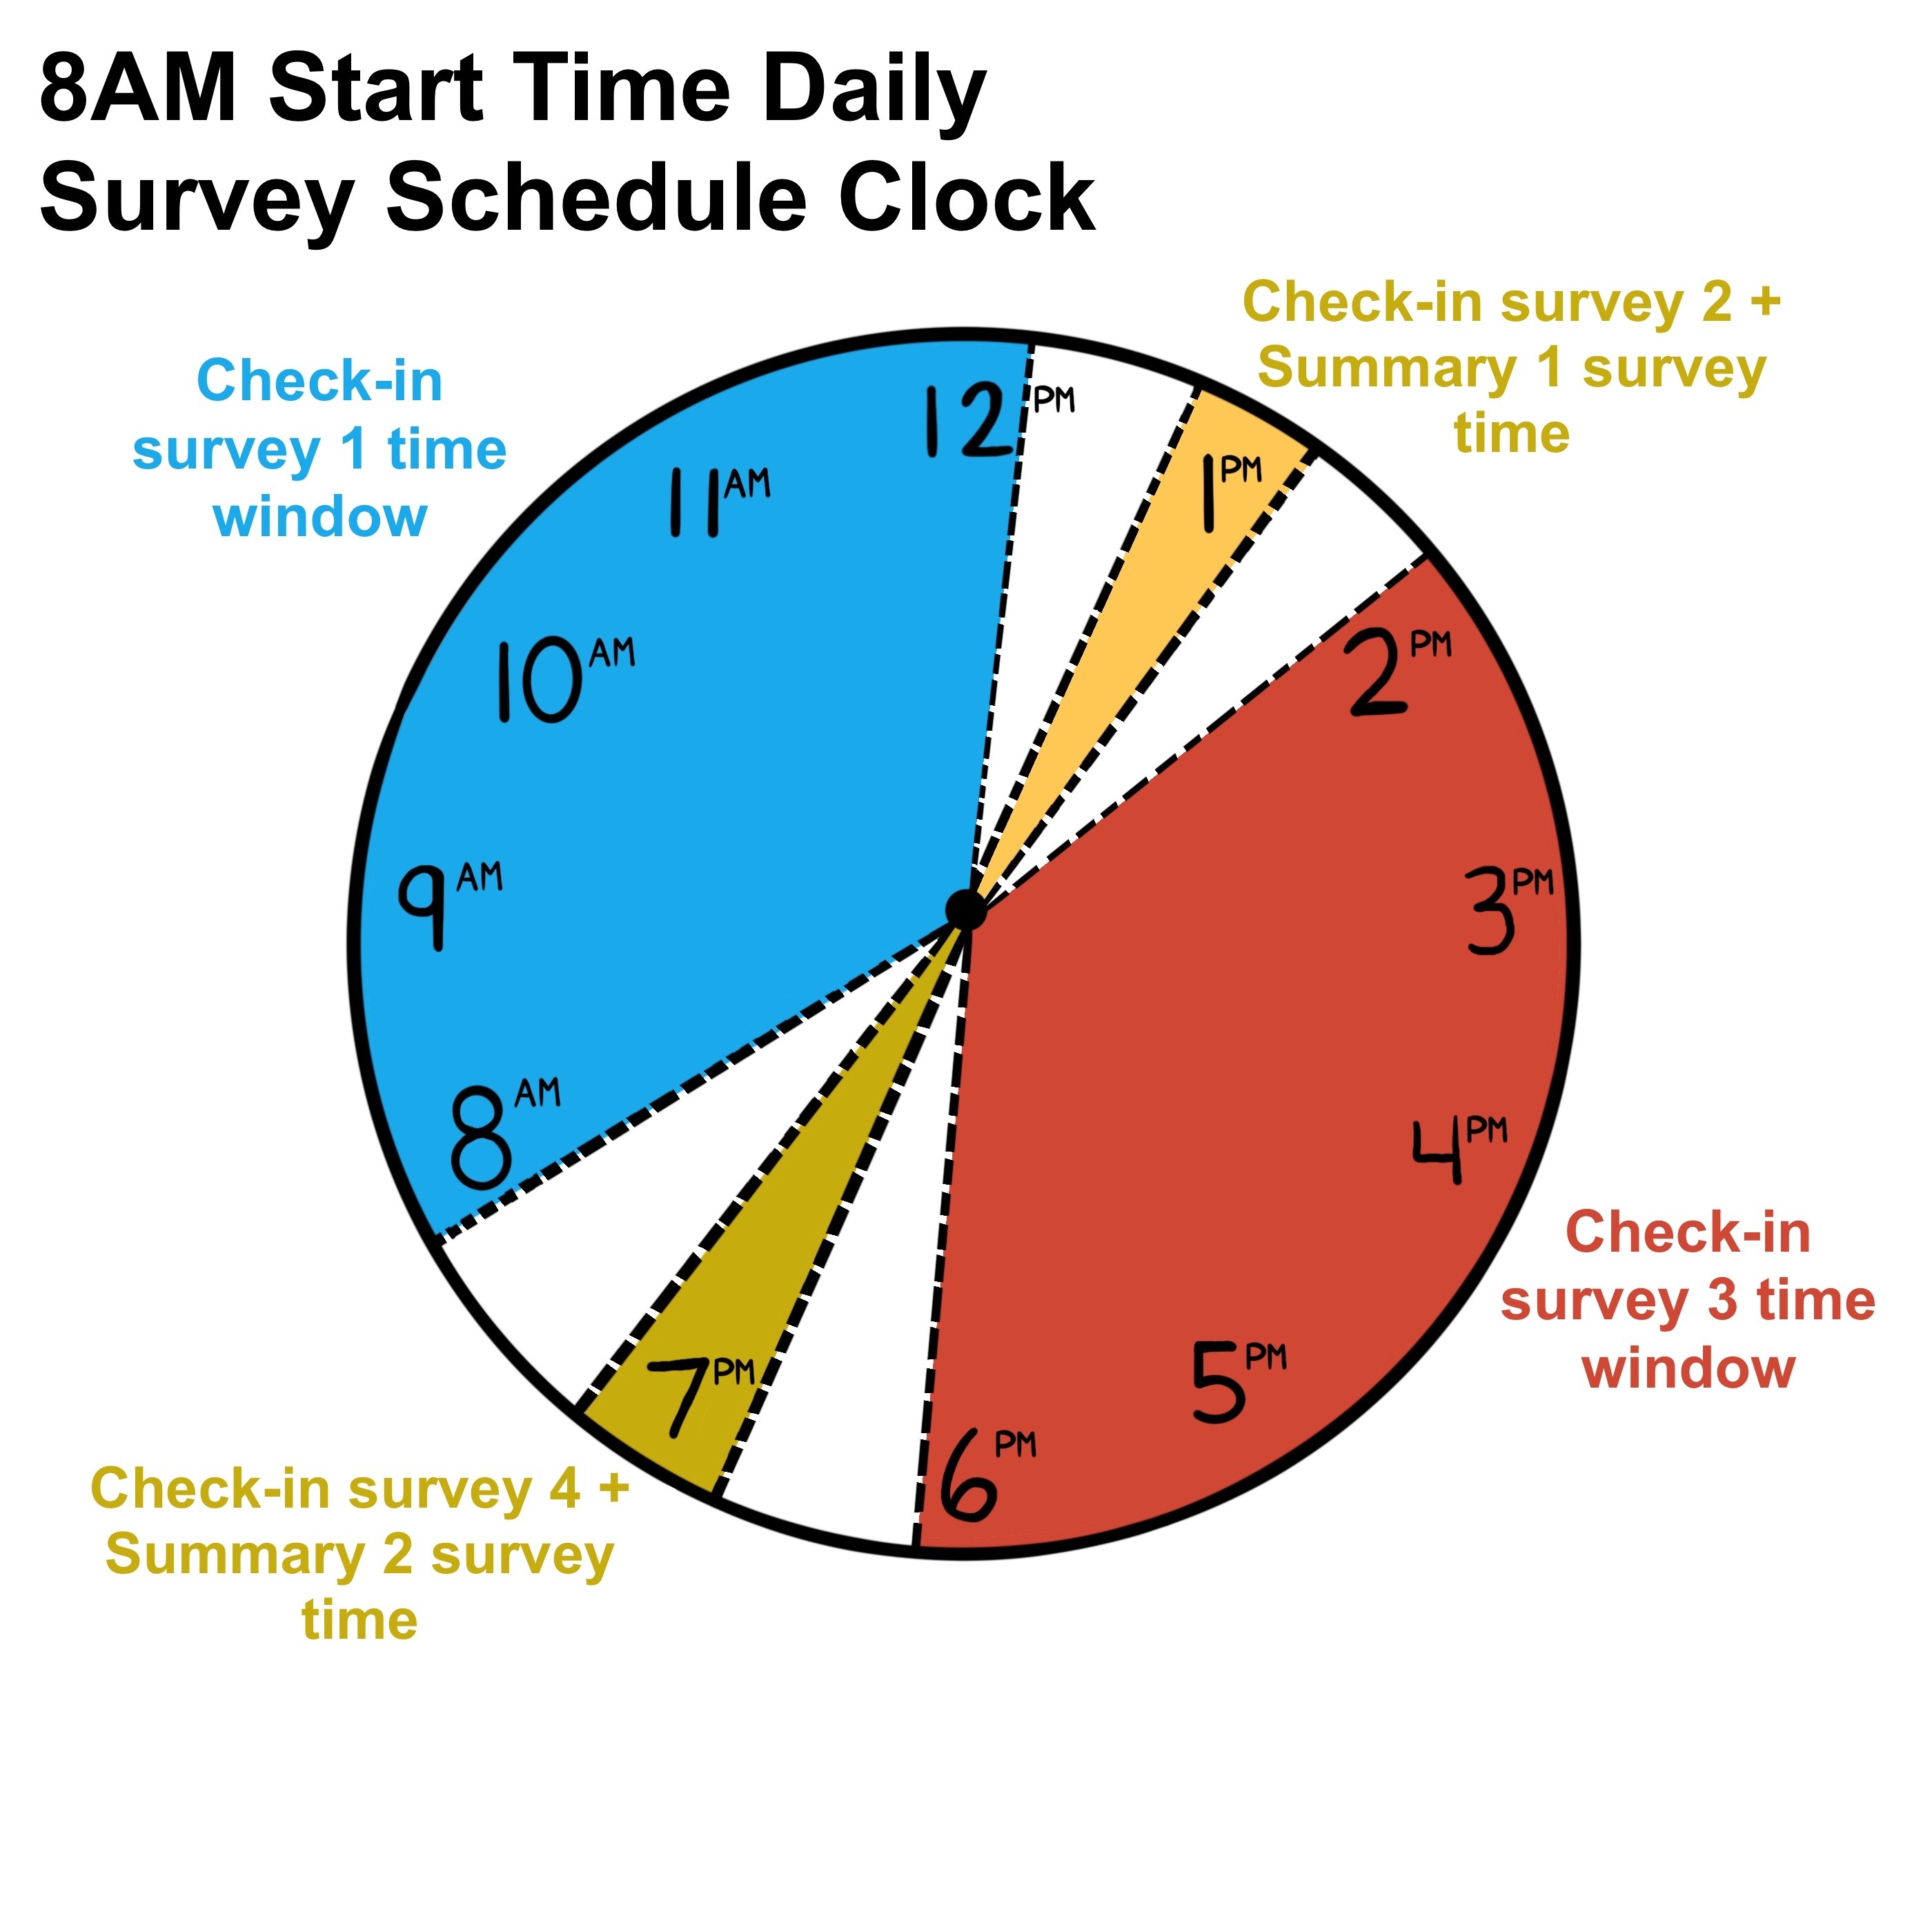
Graphic displaying exactly when participants can expect to receive surveys. Each graphic was tailored to their specific start time (e.g., 6am, 8am, 10am, 12pm), helping participants plan their day around survey prompts and reducing survey burden.